


2026 Los Angeles Real Estate Market Report

Scott Goshorn
Real estate runs deep in my blood.I grew up watching my mother hustle as a real estate agent in my home state of Ohio and her love of the business tra...
Real estate runs deep in my blood.I grew up watching my mother hustle as a real estate agent in my home state of Ohio and her love of the business tra...
The California Housing Market Holds Steady
Inventory Remains Tight, Home Values Stay Resilient, and Buyer Confidence Continues to Improve
California's housing market continued to show encouraging signs of resilience in June, with existing single-family home sales increasing for the third consecutive month compared to the same time last year. Closed sales reached a seasonally adjusted annual rate of 279,880 homes, representing a 4.1% increase from May and a 6.0% increase year-over-year. While the market remains below the 300,000 annual sales benchmark, momentum continues to build, with year-to-date sales now up 1.9%. Much of this growth has been driven by entry-level and mid-priced homes, suggesting that more buyers are finding opportunities despite today's financing environment.
Buyer activity also picked up behind the scenes. Pending sales rose 2.8% compared to last June, indicating that demand remains healthy heading into the summer. Month-over-month pending sales dipped slightly, which is fairly typical for this time of year, but broader economic factors, including geopolitical tensions and the possibility of higher energy costs, could influence mortgage rates and buyer confidence as we move further into the season. As always, real estate tends to be a long game, and buyers continue to adapt rather than disappear.
“California’s housing market ended the first half of the year on stronger footing, with home sales reaching their highest level in six months despite elevated mortgage rates and ongoing affordability challenges, As more buyers adjust to current market conditions and inventory of homes for sale continues to improve, we are encouraged that increased consumer confidence could support housing demand through the remainder of 2026.”- C.A.R. President Tamara Suminski, a Southern California broker and REALTOR®.
After reaching a record high in May, California's median home price settled back to $904,640 in June, remaining above the $900,000 mark for the third consecutive month. While that slight decline may grab headlines, it doesn't necessarily signal weakening home values. Instead, it reflects a shift in the types of homes being sold. Luxury sales above $1 million represented a smaller share of the overall market compared to May, naturally pulling the statewide median downward. In other words, it is less about prices falling and more about a changing mix of sales.
Market activity strengthened across the state, with every major California region posting year-over-year sales gains. The Far North led the way, followed by the Central Valley, Southern California, the Bay Area, and the Central Coast. At the county level, 42 of the 53 counties tracked by the California Association of REALTORS® reported increased sales, demonstrating that buyer demand continues to expand across many local markets. While a handful of counties experienced declines, many of those shifts were largely the result of lower transaction volumes rather than changing market fundamentals.
Inventory remains one of the biggest stories in today's market. The supply of available homes tightened further in June, with the Unsold Inventory Index dropping from 3.8 months last year to 3.1 months. Although active listings increased modestly from May, as they typically do during the summer, they were still 10.4% lower than a year ago, marking the fifth consecutive month of annual inventory declines. Many homeowners continue holding onto historically low mortgage rates, limiting the number of homes coming to market and helping support property values despite higher borrowing costs.
“June’s rebound in housing demand helped the market close the second quarter on firmer footing, with the broad-based increase in sales suggesting that some buyers are beginning to adapt to the current interest rate environment, however, the recent escalation of conflict in the Middle East has added renewed upward pressure on mortgage rates, which could weigh on affordability and create additional headwinds for housing demand as the summer buying season unfolds.”- C.A.R. Senior Vice President and Chief Economist Jordan Levine.
Home prices remained resilient across much of California. Thirty-five counties reported annual median price increases, while four of the state's five major regions also experienced appreciation. The Central Coast posted the strongest regional growth, followed by the Far North, Central Valley, and Southern California. The San Francisco Bay Area remained essentially flat year-over-year, although certain markets, particularly San Francisco, continue benefiting from renewed technology sector strength, rising stock values, and limited inventory, creating competitive conditions for buyers and sellers alike.
Overall, the California housing market continues to demonstrate remarkable resilience. Buyers are adjusting to today's interest rate environment, sellers continue to benefit from limited inventory, and well-priced homes are attracting strong interest. While the market is no longer moving at the rapid pace seen a few years ago, it has settled into a healthier and more balanced environment where preparation, pricing, and strategy matter more than timing alone. As we move further into the summer, inventory levels, mortgage rates, and buyer confidence will remain key indicators to watch, but the overall outlook suggests a market that remains active, stable, and full of opportunity for both buyers and sellers.
And now for the latest data on Los Angeles County real estate trends:
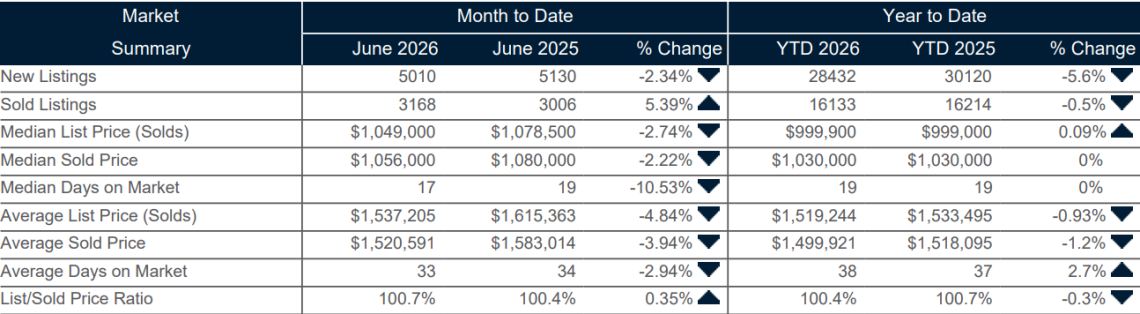
Single family homes | Los Angeles County | June 2026
New Listings: 5,010 (Down 16.60% year over year)
Homes Sold: 3,168 (Down 7.21% year over year)
Median List Price: $1,049,000 (Down .05% year over year)
Median Sales Price: $1,056,000 (Down 2.09% year over year)
Median Days on Market: 17 (Up 14.29% year over year)
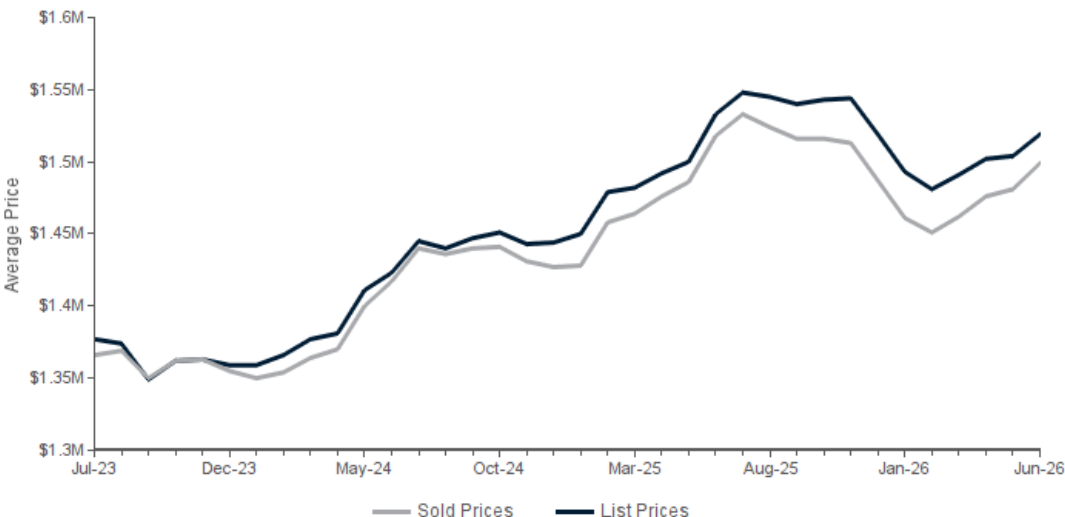
Average List Price: $1,537,205 (Down 6.62% year over year)
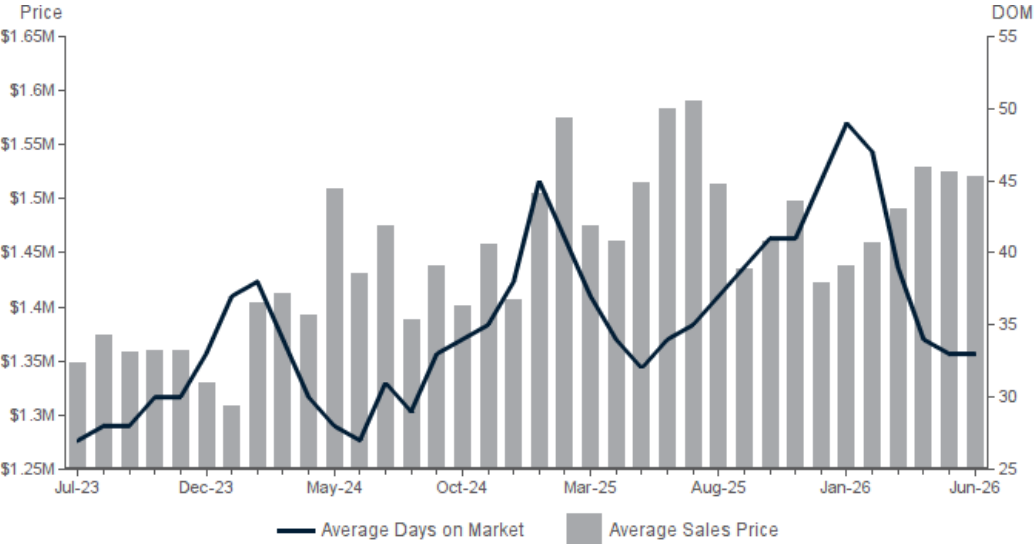
Average Sales Price: $1,520,591 (Down 7.78% year over year)
Average Days on Market: 33 (Up 9.52% year over year)
List/Sell Price Ratio: 100.70% (Down .91% year over year)
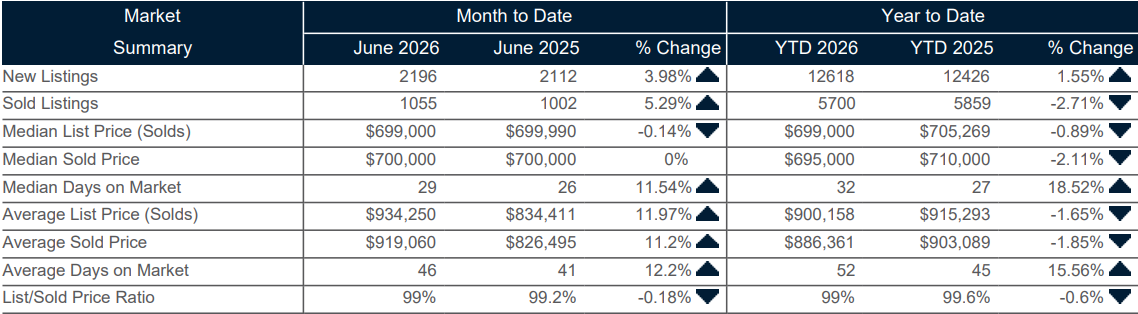
Condo homes | Los Angeles County | June 2026
New Listings: 2,196 (Down 3.49% year over year)
Homes Sold: 1,055 (Down 7.8% year over year)
Median List Price: $699,000 (Down 3.59% year over year)
Median Sales Price: $700,000 (Down 4.17% year over year)
Median Days on Market: 29 (Up 38.71% year over year)
Average List Price: $934,250 (Down 11.77% year over year)
Average Sales Price: $919,060 (Down 11.22% year over year)
Average Days on Market: 46 (Up 15.38% year over year)
List/Sell Price Ratio: 99.00% (Down .92% year over year)
Single Family Homes I June 2026 I Los Angeles County
Condo-Townhomes I June 2026 I Los Angeles County
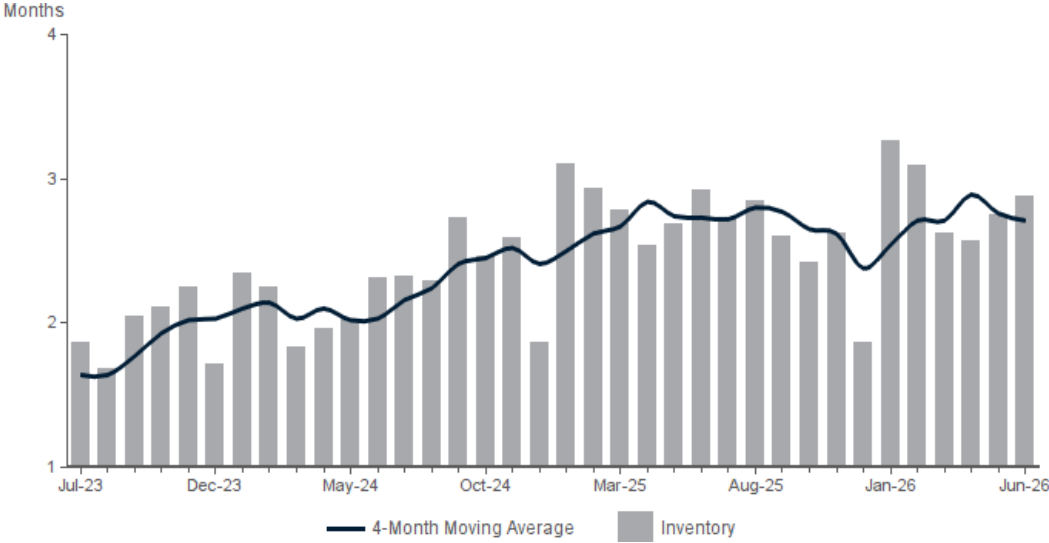
Single Family Homes I Months Supply of Inventory I Properties for sale divided by number of properties sold
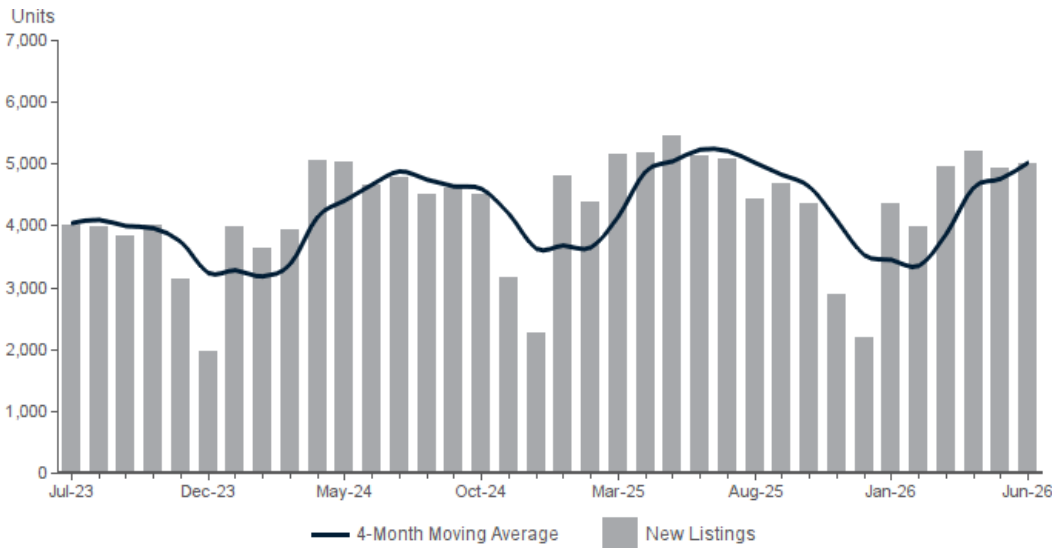
Single Family Homes I New Properties I Number of new properties listed for sale during the month
Single Family Homes I Average Sales/List Price I Average list price compared to average sold price of properties sold each month
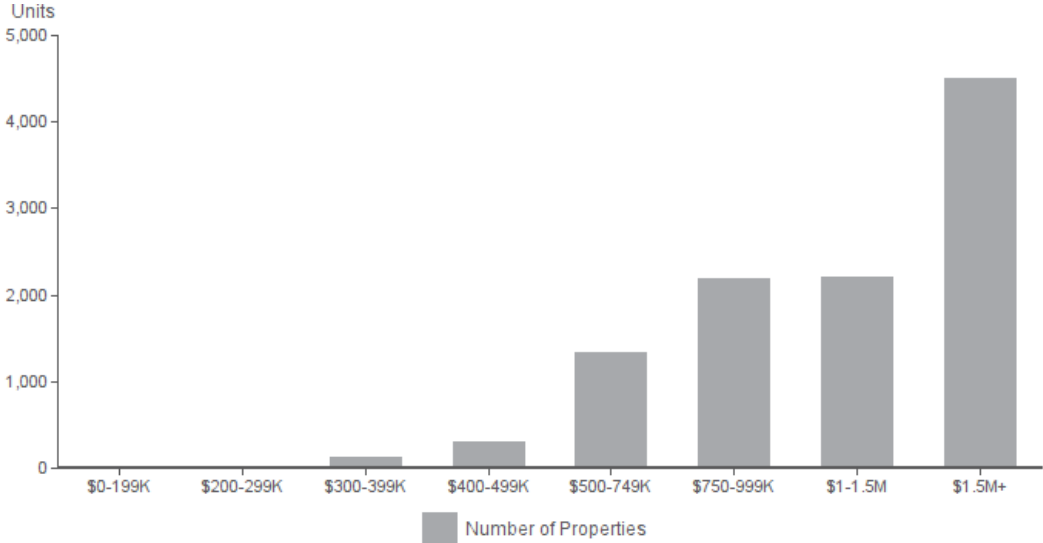
Single Family Homes I Properties for Sale I Number of properties currently listed for sale by price range
Single Family Homes I Average Sales Price and Average Days on Market
The statistics presented in the Market Report are compiled based on figures and data generated by IDC Global and Datafloat for the benefit of Rodeo Realty. Due to possible reporting inconsistencies, Days on Market (DOM), average prices and rates of appreciation should be used to analyze trends only. All information should be independently reviewed and verified for accuracy. Due to MLS reporting methods and allowable reporting policy, this data is only informational and may not be completely accurate. Data maintained by the MLSs may not reflect all real estate activity in the market. All information should be independently reviewed and verified for accuracy. Properties may or may not be listed by the office/agent presenting the information. |
Want to know what's happening in your neighborhood?
There's the state of California, the county of Los Angeles and then there's your neighborhood. If you would like a Real Estate market report for a specific zip code or neighborhood, complete this form and we'll be back in touch with you!
Thank you for reaching out!
We'll get in touch with you soon.